- About Valeport
- Accreditations
- Anti Bribery and Corruption Policy
- Applications
- Articles
- Careers
- Contact
- Cookie Policy
- Modern Slavery and Human Trafficking Policy
- Oceanographic sensors and hydrographic instruments
- Our international distributors
- pH Instrument Trial
- Privacy Policy
- Products
- rapidPro with Valeport Connect
- Services and Calibrations
- Sound Velocity Sensors
- Supplier Requirements
- Support
- Support Form Response
- Terms & Conditions of Sale of Goods & Services
- Test page
- Valeport Logo
- Warranties and Repairs
- Website Terms & Conditions
SWiFT battery endurance for uncrewed surface vessels
The Valeport SWiFT Sound Velocity Profiler (SVP) was launched in 2015. Since its launch our industry has been changing more quickly than ever, particularly with the advancement of autonomous platforms and remote solutions.
Introduction
To keep pace with these changes, the integration of sensors and instruments need to go through a similar transition. For some this can mean a complete redesign as new requirements are becoming a more important part of operational considerations.
Instrument power endurance has always been a consideration for instruments that are used for longer term deployment. We are now seeing that instruments once operated regularly by hand, now have the requirement to be remotely deployed with limited opportunities to change or charge batteries.
Current Vehicle endurance
Uncrewed surface vessels (USVs) generally fall into two main categories: those which are conventionally powered, e.g. diesel propulsion with a generator and battery systems versus those with alternative means of power, e.g. utilising solar, wind or wave, allowing much longer operational endurance.
Several factors affect a vessels endurance including, the environment, the hydrodynamics and propulsion method, the payload and the demands of the installed sensors and instruments. The endurance of the best performing traditionally powered USVs is currently up to 30 days. The endurance of vehicles with alternative means of power is > 6 months with the latest designs working towards 12 months. See Table 1 Uncrewed Surface Vessel Endurance.
| Vehicle | Continuous endurance |
|---|---|
| Ixblue Drix | 7 days |
| Kongsberg Sounder | 20 days |
| Maritime Robotics | 2 days |
| Sea-kit | 14 days |
| Sea worker 4 | 48 hours |
| Sea worker 7 | 25 days @ 2 knots |
| USS Accession Class | 20 days |
| XOCEAN | 28 days |
| Autonaut | >180 days |
| Saildrone | >180 days |
| NOTE Information in this table was collated from information freely available at the time so is subject to change. If your vehicle endurance is better than this then please contact us. | |
SWiFT development
There have been several developments to the SWiFT range, increasing the depth of operation now up to 500 m (50 bar version), the addition of an optical sensor for either: turbidity, chlorophyll, fluorescein, rhodamine, crude oil or phycocyanin, known as the SWiFT SVPplus, a conductivity temperature and depth version known as the SWiFT CTD and finally low power modes.
Low power modes
SWiFTs delivered after May 2018 have a low power mode known as Bluetooth Sleep Mode (BSM). This mode enables the user to power down the main processes leaving only the Bluetooth connection running, significantly increasing the instruments endurance. When BSM is enabled all the LEDs will be switched off and, if in range, the LED on the PC Bluetooth module will show as connected (instruments delivered from May 2018 – September 2019 show a 1Hz pulse on the Bluetooth LED when in BSM). The instrument only draws ~2.6 mA in this mode.
BSM can be turned on by utilising Valeport Ocean software, connecting to the instrument and selecting the instrument type and the relevant com port. Once the instrument is connected select the Settings and go to Bluetooth Module, tick Bluetooth Sleep Mode enabled. Select the crescent moon icon to turn on BSM. BSM can also be setup via manual commands through Valeport Terminal X2 or via another communication software. Please refer to the SWiFT integration guide for further information (instruments supplied prior to May 2018 do not show the BSM options in Valeport software).
Figure 1 Instrument Settings showing Bluetooth Module options in Valeport Ocean Software
The instrument is easily woken by selecting settings in Valeport Ocean Software, the LEDs will then come on and the instrument is then ready for deployment.
‘If you deploy the instrument while in Bluetooth Sleep Mode no profiles will be recorded.’
If you have an older SWiFT – pre-September 2019 and require it to run in a low power mode, please contact Valeport to discuss upgrading your instrument.
SWiFT Battery Endurance
The number of profiles required is related to the dynamics of the marine environment – the more changeable the water column, the more profiles are needed. Figure 2 (SWiFT SVP Battery Endurance) shows the battery endurance of the standard SWiFT SVP when utilising BSM in a range of conservative deployment scenarios. The following figures are plots derived from a SWiFT battery endurance model which considers sensor types, operational modes and parameters such as water depth, frequency of sampling, profile cycle times (setup, drop rate, recovery rate, time of upcast/downcast, calculations, and file conversion).
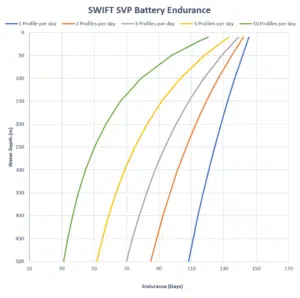
Figure 2 SWiFT SVP Battery Endurance
Figure 3 shows the battery endurance of the SWiFT SVPplus when utilising BSM in a range of conservative deployment scenarios.
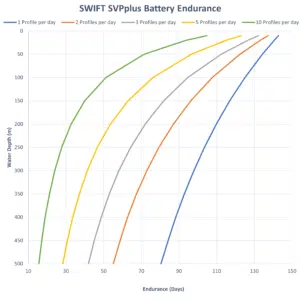
Figure 3 Swift SVPplus Battery Endurance
Figure 4 shows the battery endurance of the SWiFT CTD when utilising BSM in a range of conservative deployment scenarios.
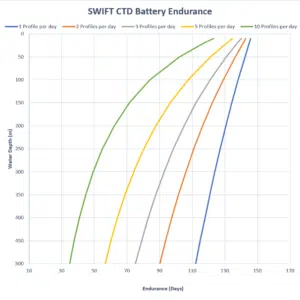
Figure 4 SWiFT CTD Battery Endurance
Figure 5 shows the battery endurance of the Swift CTDplus when utilising BSM in a range of conservative deployment scenarios.
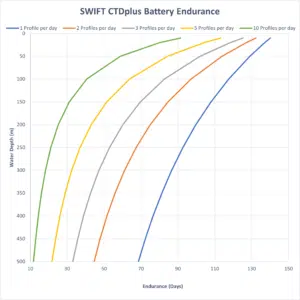
Figure 5 SWiFT CTDplus Battery Endurance
Example scenario utilising BSM
A conventionally powered USV is working in an area with known speed of sound variation and up to 150 m water depth. The vessel is taking a maximum of 4 profiles per day. Table 2 SWiFT Example Scenario Endurance (Days) details the number of days endurance that could be achieved by deploying one of the SWiFT range of sensors in this scenario.
Table 2 SWiFT Example Scenario Endurance (Days)
| SWiFT SVP | SWiFT SVPplus | SWiFT CTD | SWiFT CTDplus |
|---|---|---|---|
| 100 | 74 | 103 | 60 |
Recommendations
For best battery endurance we recommend the following:
- Bluetooth Sleep Mode can only be utilised by SWiFT instruments received after May 2018.
- SWiFT Instruments received after September 2019 have the second iteration of the Bluetooth Sleep mode and have further improved battery endurance.
- SWiFT instruments must be setup in Smart Profile Mode and with Bluetooth Sleep Mode enabled.
- Ensure the battery is completely charged prior to installing on to the vehicle.
- The SWiFT CTD and SVP (without additional sensors) have the best endurance.
Conclusions
- The SWiFT SVP can easily meet the demands of most current USV operations when using the Bluetooth Sleep Mode
- The SWiFT SVP+ has slightly reduced endurance when compared to the SWiFT SVP.
- Inductive charging could be one solution however from an operational perspective especially on larger vehicles it makes more sense to have redundant systems so having the ability to connect and deploy more than one SWiFT.
- Greater battery capacity or onboard inductive charging will be needed as USVs endurance increases.